Infosys Certified Tableau Developer
Practice with real exam-pattern questions for Infosys Certified Tableau Developer. Each question includes a detailed explanation to help you understand the concept, not just memorise the answer. Try 10 questions free — no login required.
Full question bank for this exam + 1,357+ others. Cancel anytime.
Join Premium10 Infosys Certified Tableau Developer practice questions with answers
Real Lex exam-pattern multiple-choice questions for the Infosys Certified Tableau Developer certification. Each question includes the correct answer. The full question bank is available to Premium members.
- Question 1
A view should display column chart representing sales in each category and when required it should display sales for all the sub categories in the selected category. Which of the following set of steps do you think is the most accurate one to create such a view?
- ✓ Create hierarchy (Category --> SubCategory) with Category being on the top of hierarchy. Drag hierarchy on Columns shelf and Sales on Rows shelf. Add a simple filter on Category and enable "Show Quick Filter" option. Choose Radio Button as control for selecting only a single value for Category. Whenever required, Category can be drilled down to display sales for all the subcategories in the selected Category. Correct
- B Drag Category followed by Sub Category on Columns shelf and Sales on Rows shelf. Add a simple filter on Category and enable "Show Quick Filter" option. Choose Radio Button as control for selecting only a single value for Category.
- C Drag Category followed by Sub Category on Columns shelf and Sales on Rows shelf. Add a simple filter on Category. Choose Radio Button as control for selecting only a single value for Category.
- D Create hierarchy (Category --> SubCategory) with category being on the top of hierarchy. Drag hierarchy on Columns shelf and Sales on Rows shelf. Add a simple filter on Category and choose Radio Button as control for selecting only a single value for Category. Whenever required, Category can be drilled down to display sales for all the subcategories in the selected Category.
- Question 2
Values provided by users through _____ can be used to perform calculations.
- ✓ Filters Correct
- B Calculated Fields
- C Parameters
- D Tableau doesn't support Parameters
- Question 3
Big-Edge Ltd. has HR unit maintaining their sales executives' details in Excel format wherein company's CRM unit takes support from IT division to maintain customers' data on SQL Server. In order to generate a visualization to assess performances of their sales-executives w.r.t. customers' ratings, amount sold etc., data from both sources must be fetched. What do you suggest should be done in order to get combined data for further analysis?
- ✓ Join Correct
- B Join with Custom SQL
- C Blending
- D Not possible to achieve this without ETL
- Question 4
To be able to use "Add All Subtotals" option under Totals in Analysis menu the view must have at least __________ dimensions in Rows or Columns shelf.
- ✓ 1 Correct
- B 2
- C 3
- D 4
- Question 5
Which of the following ETL operations can be performed by Tableau to help with Data Preparation?
- ✓ Splitting Columns of data into multiple Columns Correct
- B Creating aliases of data to help dealing with duplicates
- C Cleaning up files by removing blanks and extra headers
- D All of them
- Question 6
For Quick Filters on a dimension which of the following control(s) is/are possible for users to select values from?
i. Multi-Select List
ii. Radio Button
iii. Checkboxes
iv. Dropdown
- ✓ All of them Correct
- B i and iii only
- C ii and iv only
- D iv only
- Question 7
When we create a set for a Measure, where does it get placed?
- ✓ Measure area Correct
- B Dimension area
- C Set area
- D A Set cannot be created for a Measure.
- Question 8
GreenBay Pvt. Ltd. uses a table to display total Carbon-Footprints of their plants in various cities in last 4 years with cities forming rows and years forming columns. Refer to the image below.
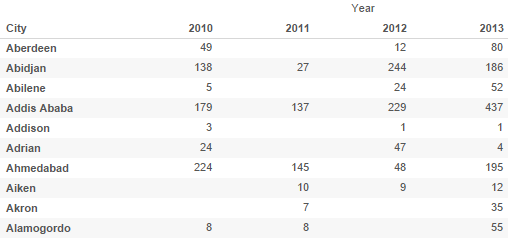
To analyze it further company wants to see average Carbon-Footprints in last 4 years for each city. What should be done in Analysis menu to get this view?- ✓ Check “Show Column Grand Totals” and use “Average” for “Total All Using” under Totals. Correct
- B Check “Show Column Grand Totals” and use “Sum” for “Total All Using” under Totals.
- C Check “Add All SubTotals” and use “Average” for “Total All Using” under Totals.
- D Check “Show Row Grand Totals” and use “Average” for “Total All Using” under Totals.
- Question 9
Shoppers' Spot, a retail store wants to give special privileges to its repeat premium customers.In order to do so the store needs a list of all the customers who have shopped for more than 25000/- in a year consecutively for last 2 years.
Which of the following is the solution to fulfil the requirement?- ✓ Create Combined Set with "Shared Members in Both Sets" option Correct
- B Create Combined Set with "All Members in Both Sets" option
- C Create Combined Set with "Set1 except shared members" option
- D Create Combined Set with "Set2 except shared members" option
- Question 10
Which of the following trend models are supported by Tableau?
- ✓ Polynomial, Linear, Logarithmic, Exponential Correct
- B Polynomial, Linear, Logarithmic, Power
- C Linear, Quadratic, Cubic, Polynomial
- D S-Curve, Polynomial, Exponential, Linear
More in DNA
Infosys Certified Databricks Analyst
Infosys Certified Snowflake Advanced Developer
Infosys Certified Tableau Desktop Advanced Developer
Pay once. Clear every cert this year.
One subscription, full Telegram channel access, every PDF posted during your membership.
- Full access to all 1,357+ certifications
- Monthly updated question banks
- Telegram private channel access
- Cancel anytime
- Everything in Monthly
- Save ₹2,100 vs monthly billing
- Priority answer key requests
- Best for increasing DQ score fast
- Everything in Quarterly
- Lifetime channel access — no renewals
- All future certifications included
- Priority response from admin team
Common questions, straight answers.
A monthly-updated Telegram channel where we post real exam-pattern question banks and detailed answer keys for 1,357+ Infosys Lex certifications. You join once, you get every PDF posted during your membership.
Right after payment on our Graphy page, you'll receive a private invite link to the Telegram channel. Access is instant — usually under 30 seconds.
We compile question banks from the actual Lex test pattern, sourced and verified by 180K+ community members who've recently cleared these exams. Match rate is consistently 85–95%.
Every single month. When Infosys rolls out new versions of certifications, we post updated dumps within 7–10 days. You'll see channel activity weekly.
Clearing certifications is one of the highest-weighted DQ factors. Members typically clear 3–5 certifications in their first 3 months, which moves DQ scores up by a full band.